


Bitcoin continues to struggle below the $90,000 level, failing to reclaim higher ground as bulls focus on defending current demand zones. After a sharp correction from recent highs, price action has entered a consolidation phase that, on the surface, appears relatively calm. Volatility has compressed, and short-term price movements suggest a market pausing rather than decisively breaking down. However, this apparent stability may be misleading.
Related Reading
According to a CryptoQuant report from XWIN Research Japan, on-chain data is signaling growing structural risk beneath the surface. The Inter-Exchange Flow Pulse (IFP), a metric that tracks the movement of Bitcoin between exchanges and serves as a proxy for internal market liquidity, has turned red.
In such environments, price moves tend to be sharper and less orderly once direction is established. While reduced exchange balances can limit immediate selling pressure, they also amplify the impact of sudden demand or forced liquidations.
This shift indicates a clear slowdown in capital circulation across trading venues, suggesting that liquidity conditions are deteriorating.
Inter-Exchange Flow Pulse Signals Structural Fragility
The report explains that the Inter-Exchange Flow Pulse (IFP) measures how actively Bitcoin moves from one exchange to another, serving as a proxy for internal market liquidity and capital circulation. When IFP is elevated, capital rotates efficiently across venues, arbitrage opportunities are quickly absorbed, and liquidity providers keep order books deep.
In those conditions, price discovery is smoother, and volatility tends to remain contained. By contrast, when IFP declines, the market’s internal “blood flow” weakens. Capital becomes static, liquidity fragments, and prices grow increasingly sensitive to relatively small trades.
This deterioration in liquidity is unfolding alongside historically low exchange balances. While reduced sellable supply can initially act as price support, it also creates thinner order books. Once price begins to move decisively in either direction, slippage increases and volatility accelerates.
With leverage still elevated across derivatives markets, instability becomes driven less by directional conviction and more by the magnitude of forced reactions.
Historically, periods when IFP turned red produced abrupt corrections and sharp price swings, not clean trends. The central risk today is therefore not aggressive distribution, but structural fragility. Until inter-exchange liquidity improves, Bitcoin remains vulnerable to sudden, outsized moves, making leveraged positioning particularly risky in the current market structure.
Related Reading
Bitcoin Price Consolidates Below Key Moving Averages
The 4-hour Bitcoin chart highlights a market locked in consolidation after a sharp corrective move. Following the aggressive sell-off in late November, BTC found a local bottom near the $82,000–$83,000 zone, where strong demand stepped in and triggered a rebound. However, that recovery quickly lost momentum, and price is now ranging below the descending cluster of moving averages.
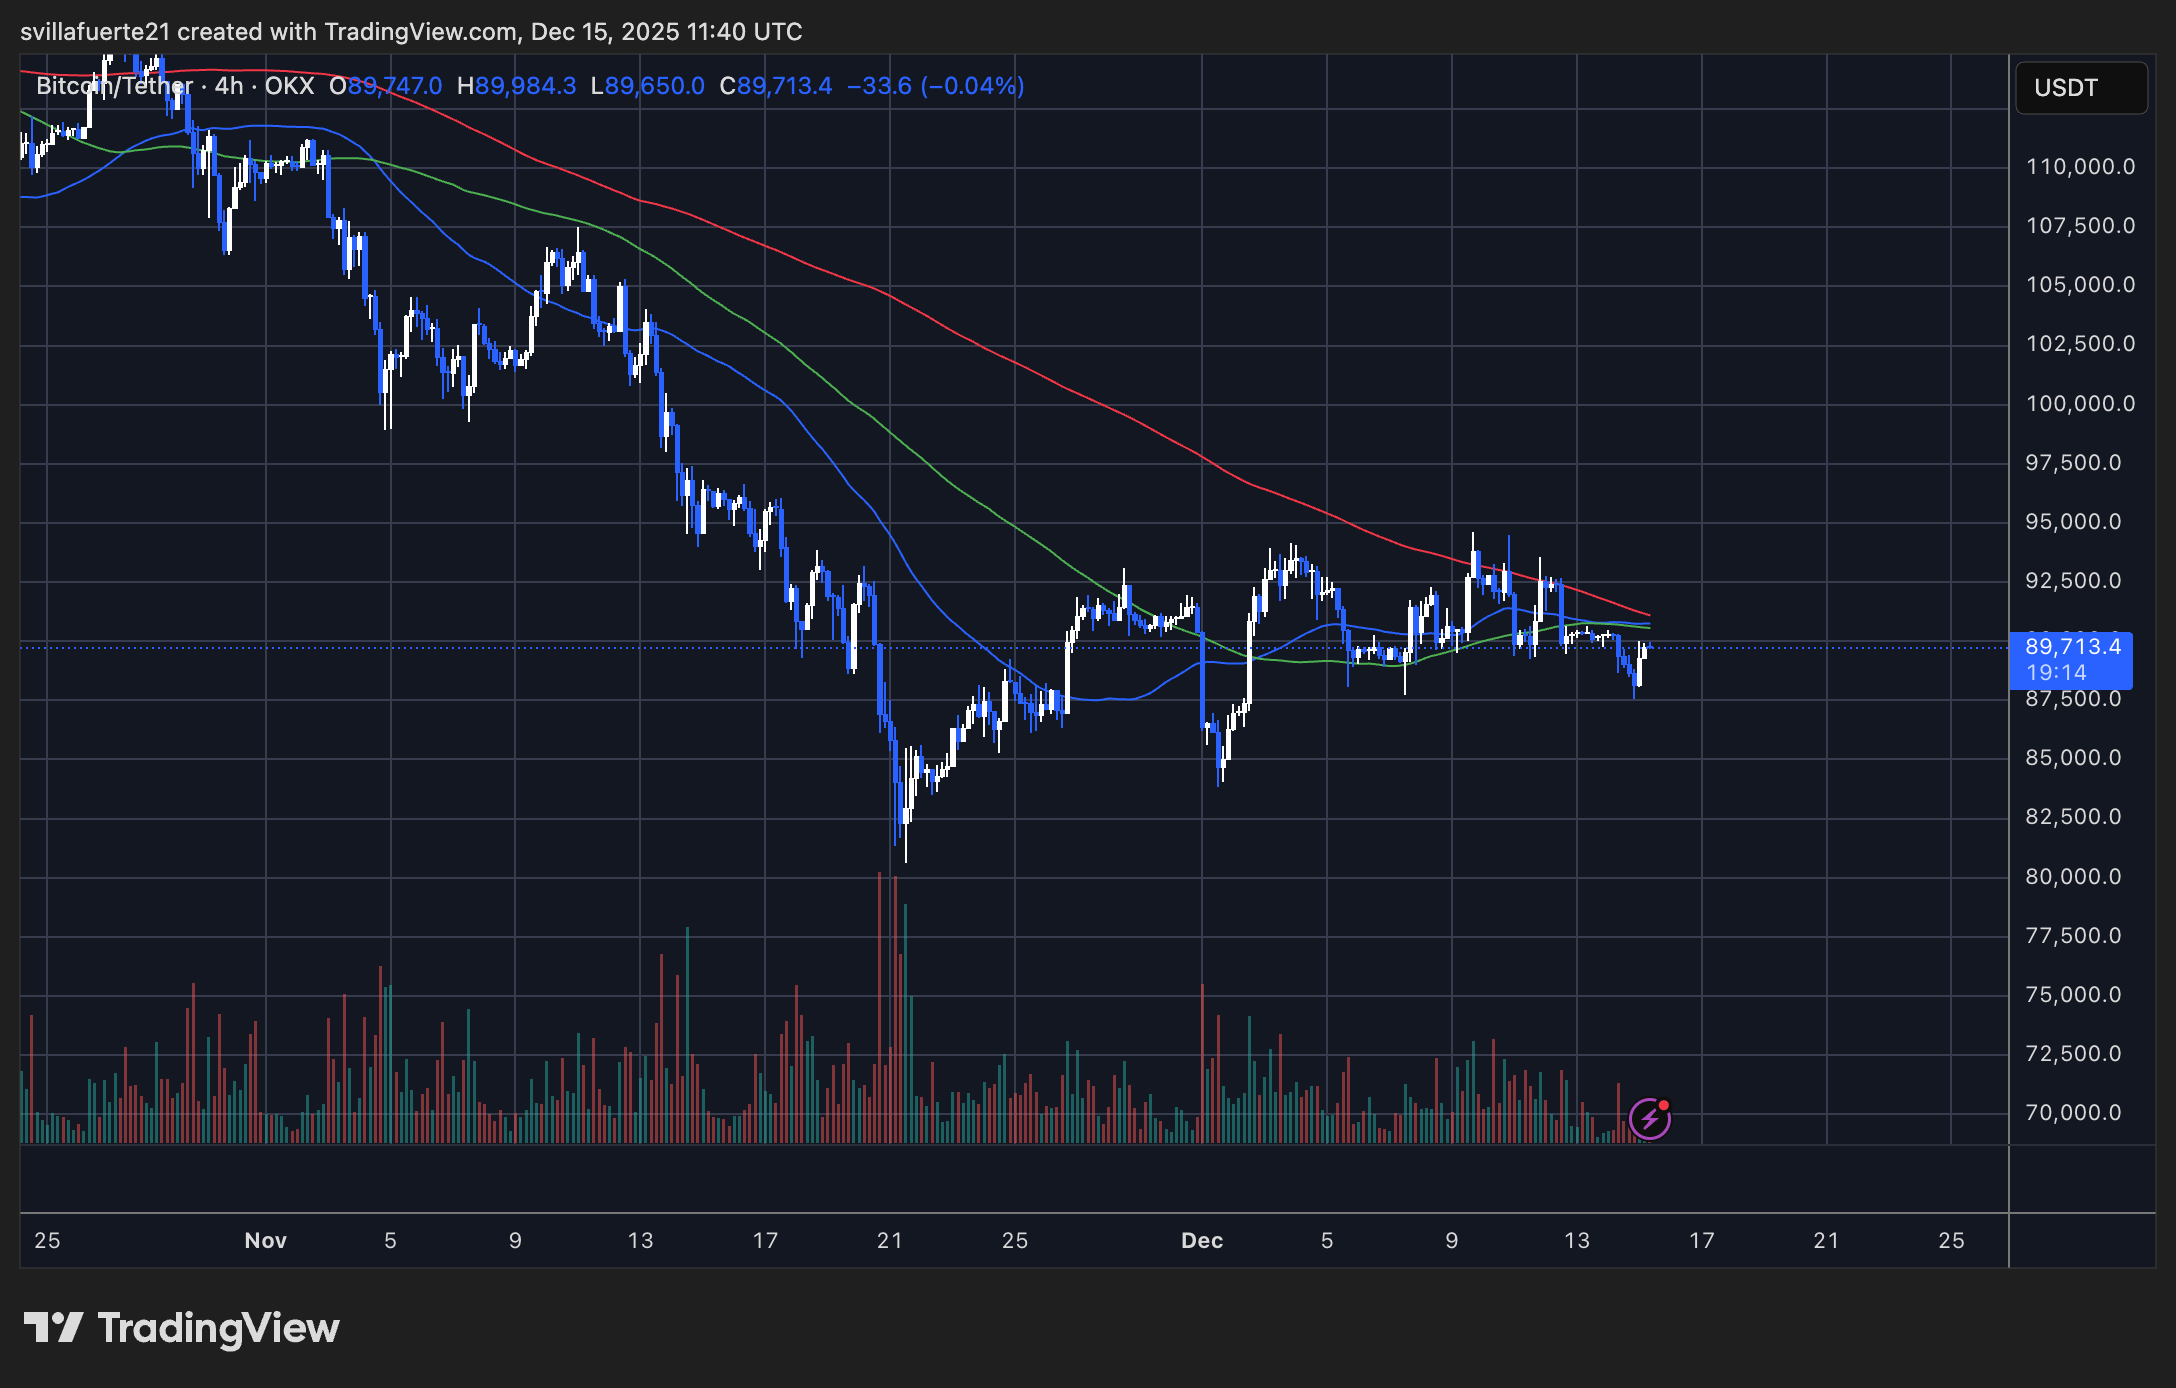
Bitcoin is currently trading around the $89,000–$90,000 level, repeatedly failing to reclaim the 200-period moving average on the 4-hour timeframe. The 50 and 100 moving averages are also sloping downward, acting as dynamic resistance and reinforcing the short-term bearish structure. Each attempt to push higher has been met with selling pressure, suggesting that bulls lack conviction at current levels.
Related Reading
Volume has noticeably contracted during this consolidation phase, indicating reduced participation and indecision among traders. This typically precedes a volatility expansion, especially when price compresses beneath major resistance. Structurally, BTC remains vulnerable as long as it trades below the $92,000–$94,000 zone, which previously acted as support and now caps upside attempts.
On the downside, the $87,000–$88,000 range is emerging as immediate support. A decisive breakdown below this area could reopen the path toward the $84,000 region. Until a clear breakout occurs, Bitcoin remains in a fragile balance between distribution and base-building.
Featured image from ChatGPT, chart from TradingView.com
Source link
Sebastian Villafuerte
https://www.newsbtc.com/bitcoin-news/why-bitcoins-quiet-price-action-may-be-dangerous-ifp-signals-rising-structural-risk/
2025-12-15 20:00:00