


Ethereum price started a fresh decline below $3,000. ETH is now consolidating and might soon aim to start a recovery wave above $2,980.
- Ethereum started a fresh decline from the $3,175 zone.
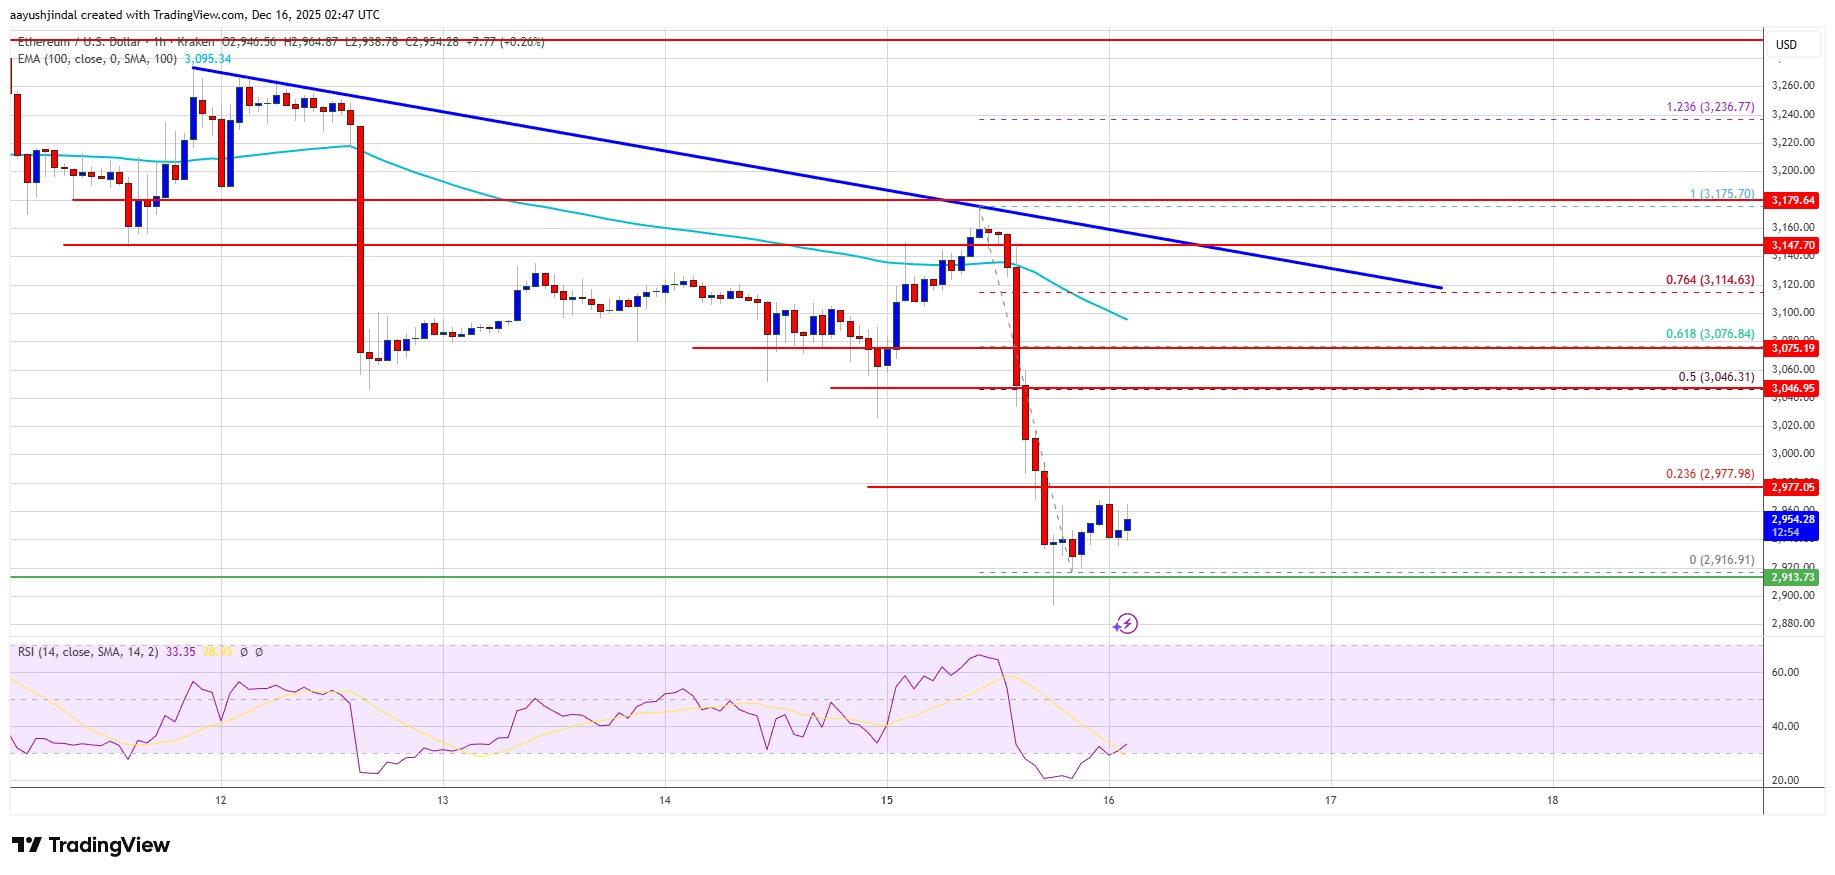
- The price is trading below $3,000 and the 100-hourly Simple Moving Average.
- There is a connecting bearish trend line forming with resistance at $3,120 on the hourly chart of ETH/USD (data feed via Kraken).
- The pair could continue to move down if it settles below the $2,920 zone.
Ethereum Price Dips 5%
Ethereum price failed to stay above $3,150 and started a fresh decline, like Bitcoin. ETH price dipped below $3,120 and $3,050 to enter a bearish zone.
The bears even pushed the price below $3,000. A low was formed at $2,916 and the price is now consolidating losses below the 23.6% Fib retracement level of the downward move from the $3,175 swing high to the $2,916 low.
Ethereum price is now trading below $3,000 and the 100-hourly Simple Moving Average. Besides, there is a connecting bearish trend line forming with resistance at $3,120 on the hourly chart of ETH/USD.
If there is another upward move, the price could face resistance near the $2,980 level. The next key resistance is near the $3,050 level and the 50% Fib retracement level of the downward move from the $3,175 swing high to the $2,916 low. The first major resistance is near the $3,080 level. A clear move above the $3,080 resistance might send the price toward the $3,120 resistance. An upside break above the $3,120 region might call for more gains in the coming days. In the stated case, Ether could rise toward the $3,175 resistance zone or even $3,200 in the near term.
More Losses In ETH?
If Ethereum fails to clear the $2,980 resistance, it could start a fresh decline. Initial support on the downside is near the $2,950 level. The first major support sits near the $2,920 zone.
A clear move below the $2,920 support might push the price toward the $2,880 support. Any more losses might send the price toward the $2,840 region. The next key support sits at $2,800.
Technical Indicators
Hourly MACD – The MACD for ETH/USD is gaining momentum in the bearish zone.
Hourly RSI – The RSI for ETH/USD is now below the 50 zone.
Major Support Level – $2,920
Major Resistance Level – $3,080
Source link
Aayush Jindal
https://www.newsbtc.com/analysis/eth/ethereum-price-sinks-under-3k/
2025-12-16 03:18:00


 ETFs Continue to Outperform BTC, ETH Funds Despite Cooling Inflows")
 ETFs Continue to Outperform BTC, ETH Funds Despite Cooling Inflows")

